How to Start Your Data Analysis on Dune Analytics

Introduction
You’re likely familiar with using dashboards for data analysis in finance, similar to how we use Excel to understand complex data. In Web3, dashboards are equally useful for interpreting blockchain statistics. These visualization tools present complex information clearly, making it easier to navigate the web3 landscape.
To start our analysis, I’ll introduce Dune, the tool we'll be using. Dune allows users to query public blockchain data and create beautiful dashboards with simple SQL. Even if you're new to SQL, Dune has an automatic query-fixing function to help. For beginners, understanding the logic of blockchain to filter needed information is more crucial than the coding part.
Now, I'll share my experience creating a dashboard that shows historical transaction amounts grouped by different symbols and classified into deposits, withdrawals, and repayments. If you want to see the result, please check here.
Laying the Groundwork
Before we dive into using Dune, we need a few essential tools for our analysis.
Understanding the structure and details of blockchain data is crucial, and that's where Etherscan comes in. Etherscan is a block explorer that allows direct access to Ethereum data. You can also use other explorers like OkLink if you prefer.
Furthermore, Dune has a Discord channel. The community can be a valuable resource if you face difficulties with your queries.
Now, let’s get started.
Here's the framework for the case study:
- Data Catalog: Choose which data catalog to use and identify the key traits of the target data.
- Raw Data Export: Export raw data and interpret it using various methods, such as matching with another database like ERC20 for token symbols.
- Historical Prices: Transaction data includes token type and amount. To calculate actual transaction values, reference a price database to match information across tables.
- Final Chart: Combine all queries to create the final chart.
Determining the Data Filter
I used the ethereum.logs data for my analysis because it provides detailed historical transaction information.
The first step involves accessing data on Etherscan, specifically a "contract address," which logs all activities of your target platform on the blockchain. On the contract page, each transaction is tagged with a unique tx_hash for differentiation. This is useful for verifying the correctness of exported data later on.
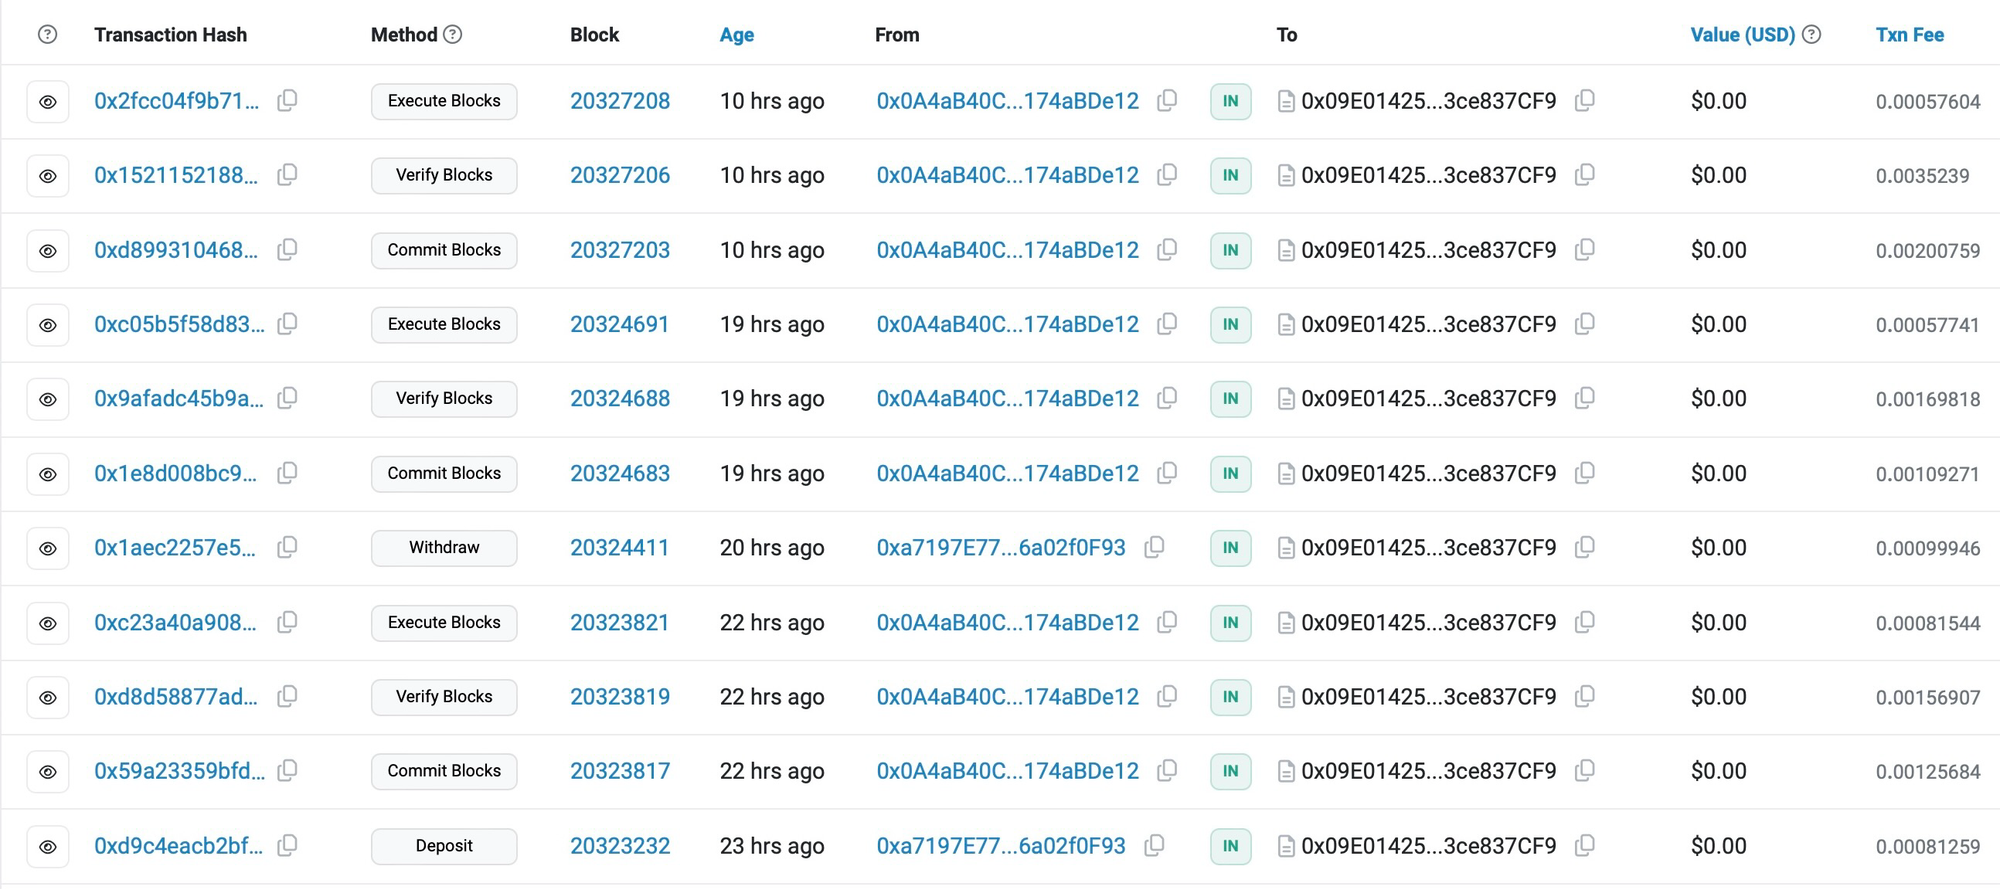
Next, we randomly select a “repay” transaction and check its “logs” for the transaction receipt event logs. The necessary data is stored in an event named “Repayment,” with topics0 being the key identifier for tracking all repayments under this contract.
Additionally, this event logs the debt token and transaction amount, although both are in HEX form and require further interpretation.
Exporting and Interpreting the Data
Once we have all the information, it's time to export and interpret the data on Dune by creating a query for the transaction data.
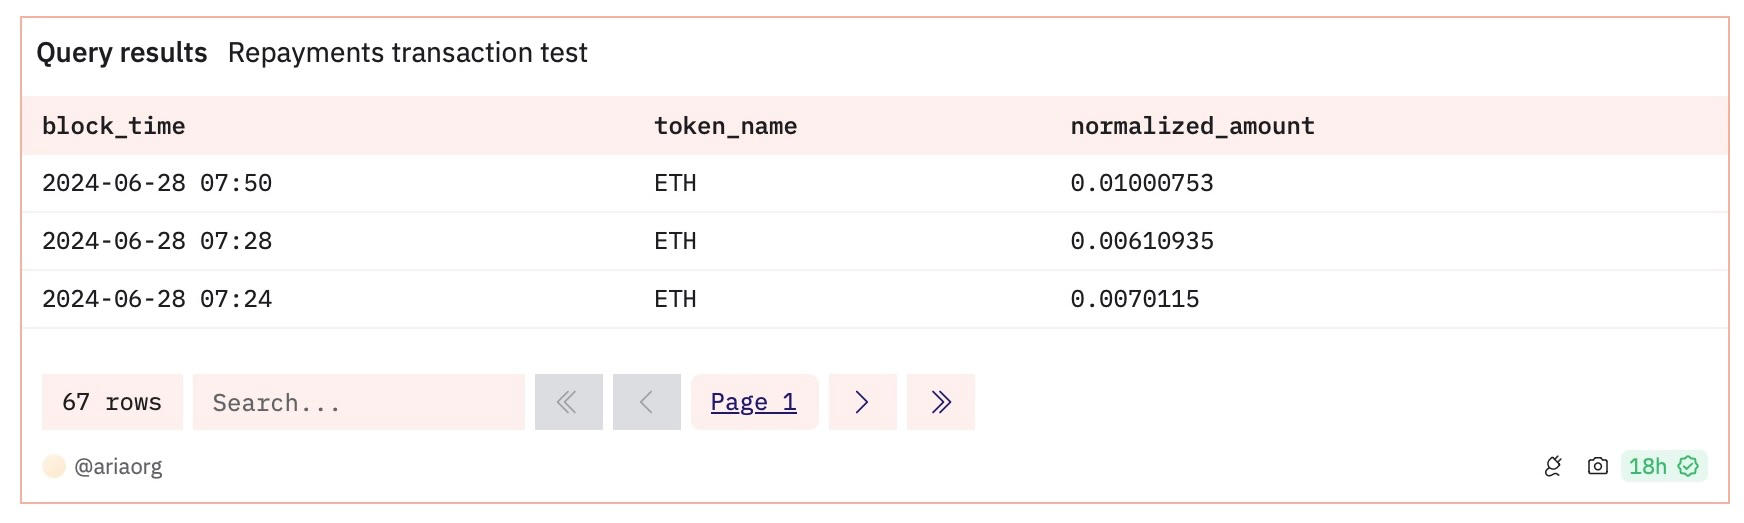
I used two methods based on different scenarios to optimize the raw data. The tokens.erc20 database translates the token symbol from HEX. Additionally, since each token is typically expressed in different units, the token amount must be converted from its original form to a standard unit. For example, the smallest unit for Wrapped Ether (wETH) is wei, which is 10**-18 (Ten to the negative eighteenth power) of 1 wETH. Therefore, we must divide its value by 1e18 to convert it to regular Ether units. One thing worth noting is that not all tokens use 18 decimal places like wETH or ETH does.
Here's how I completed the process: by creating a common table expression for transaction_data and token_symbols, the data interpretation steps are streamlined. The result of this query will include the block_time, token_name, and the normalized amount, as shown in the following figure.
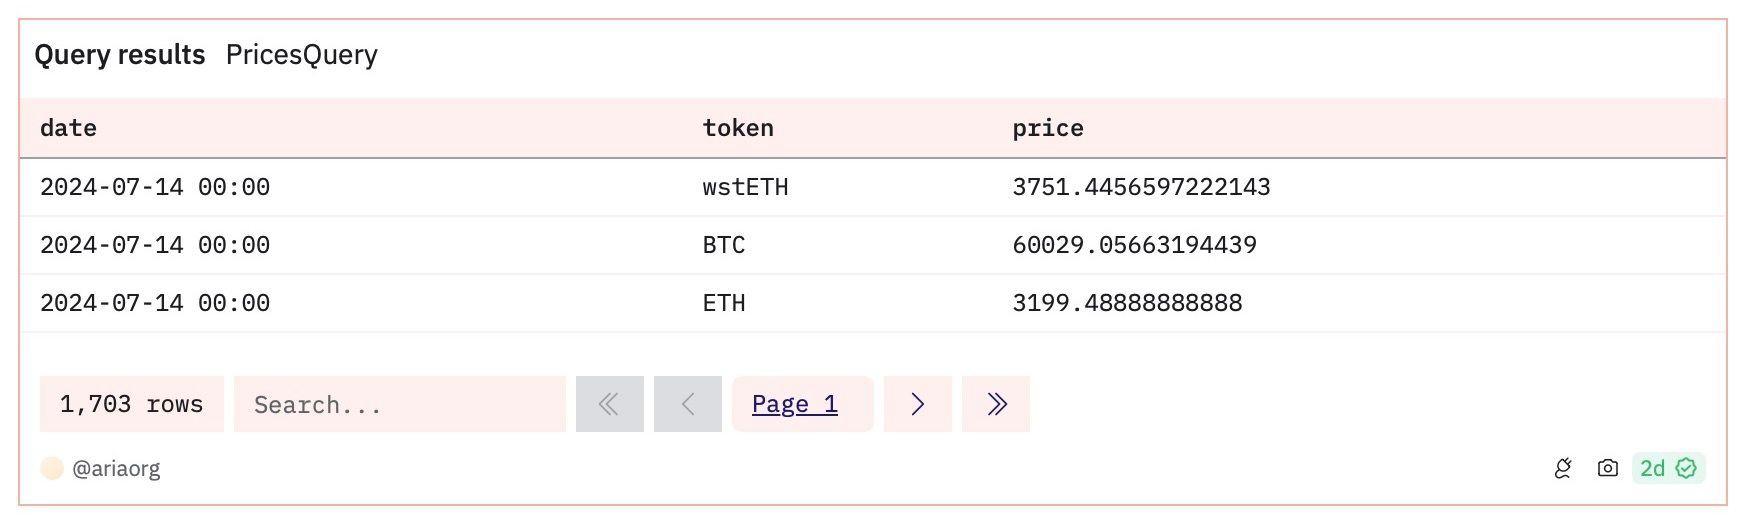
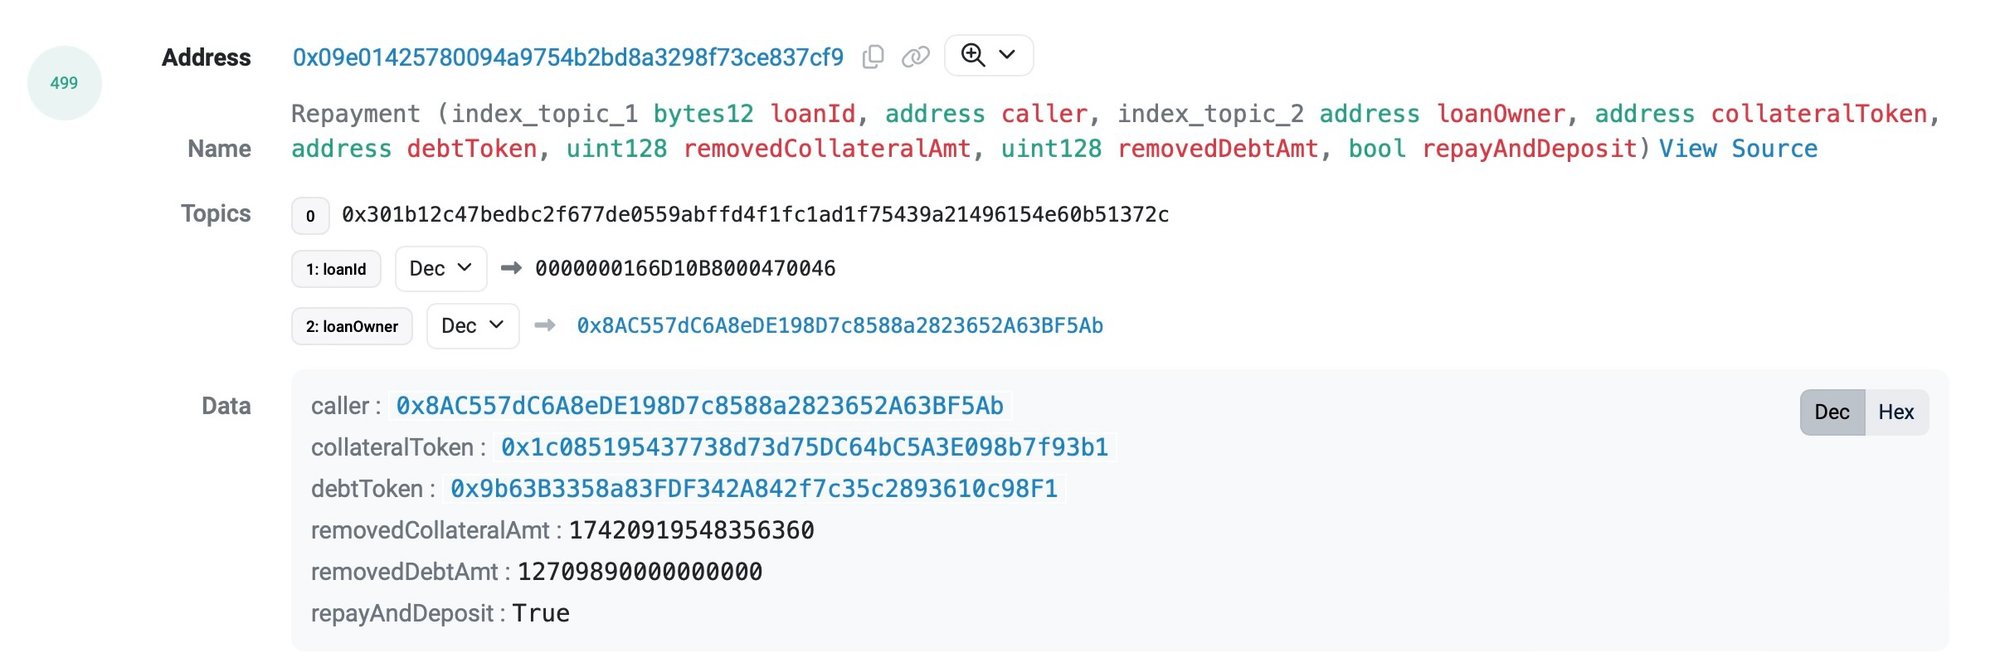
Query Historical Prices
Due to SQL length restrictions on Dune, we need to combine several queries to create the final chart. Therefore. I created a separate query for historical prices using the prices.usd_daily catalog. Since prices are updated multiple times daily, I selected the median price for each day to ensure accuracy.
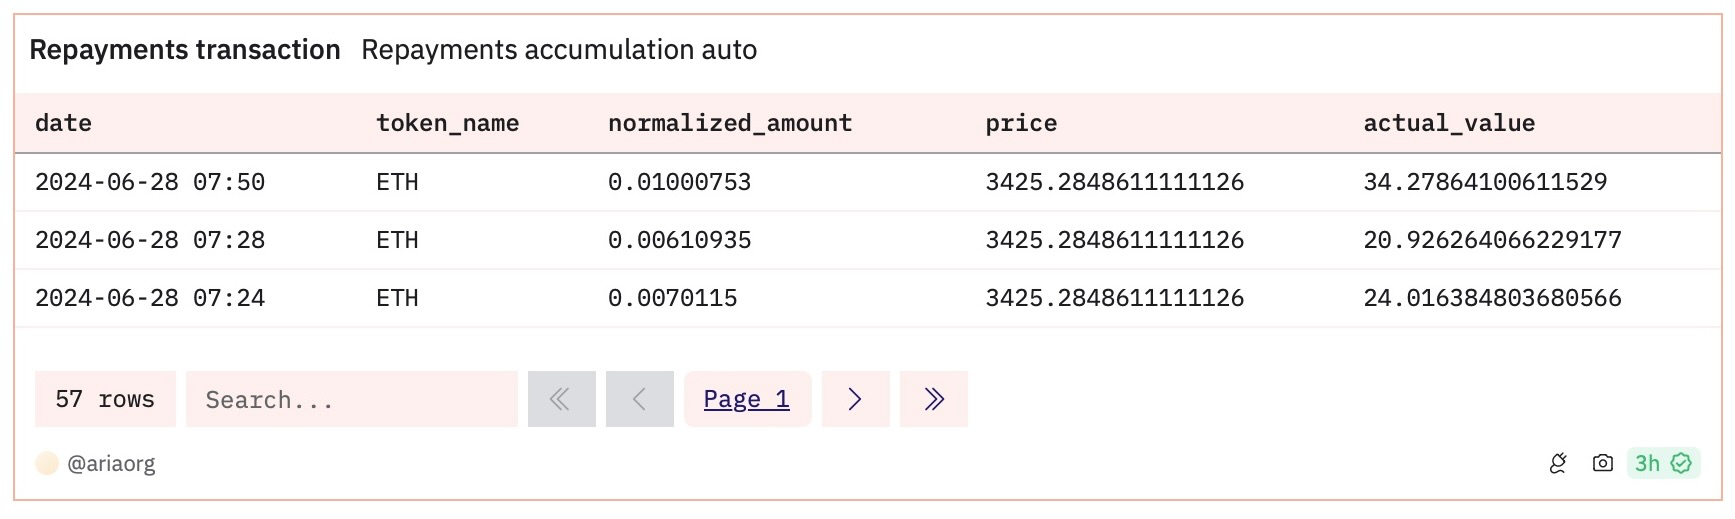
Putting Together All Queries
The final step is to compile all the cleaned data to create the final chart. Note that these queries must be materialized for reference in the new query.
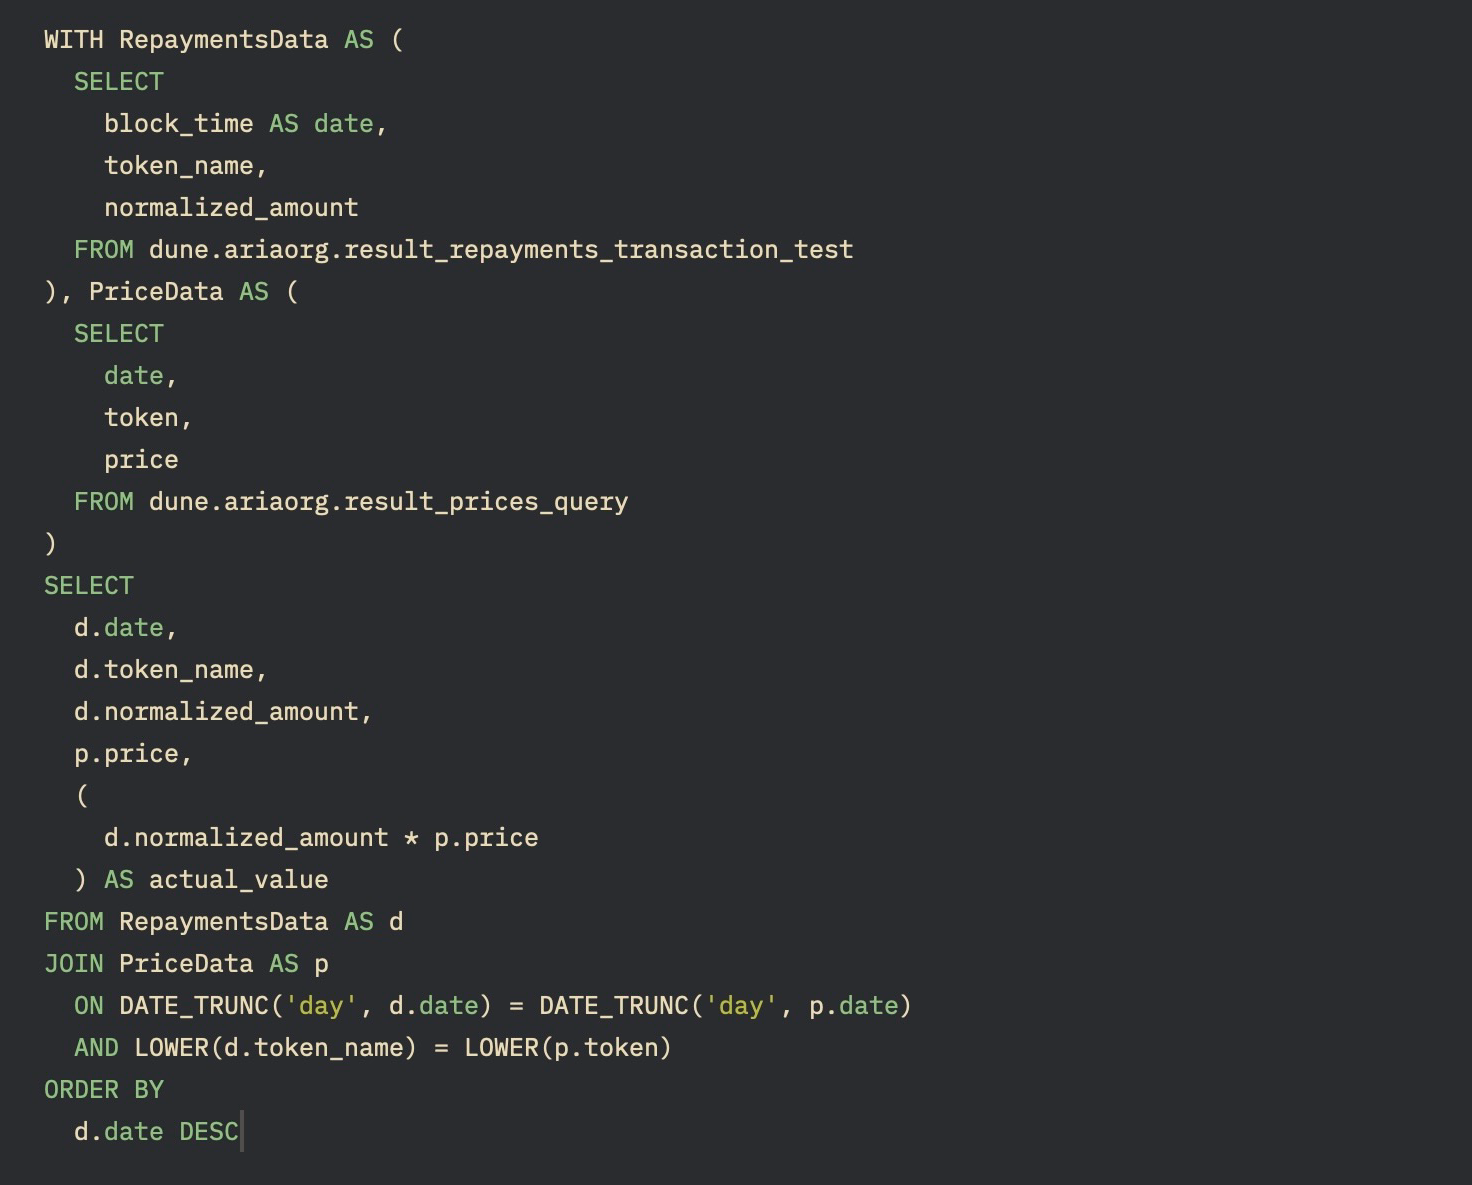
We use common table expressions to combine the data here. Once completed, we’ll have a figure on Dune that updates automatically with each new block, as the data is directly extracted from the blockchain. There’s no need for further adjustments.
Conclusion
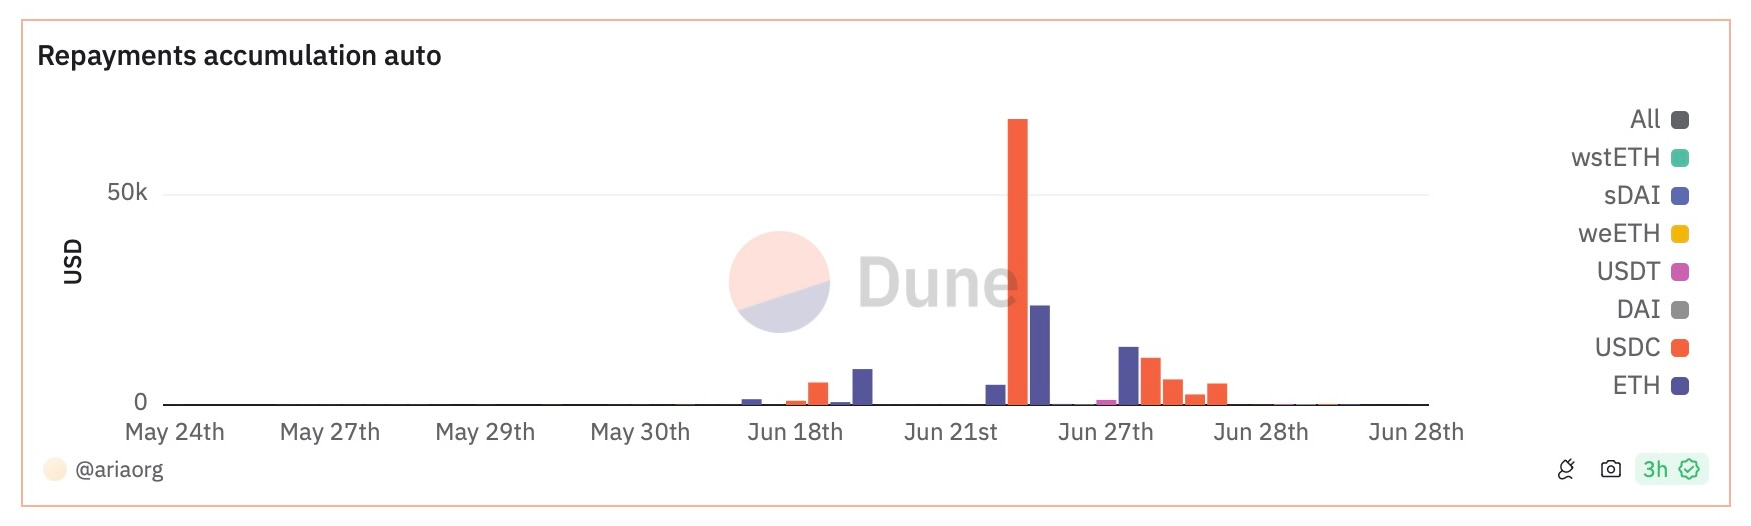
Since all data is publicly stored on the blockchain, you can create various diagrams with different data types on your dashboard. Below is an example of the dashboard I created:
I hope this guide makes analyzing Web3 data more accessible to you. Remember, I’m also a beginner! Creating a dashboard on Dune is simpler and more convenient than using traditional methods like Excel. The transparency and openness of blockchain obviates the need for web crawling or purchasing data. Blockchain data is also more organized, reducing the effort of data cleaning.
Beyond creating dashboards on Dune, there are more possibilities for data analysis in Web3, such as conducting machine learning with Python. If you're familiar with traditional analysis tools, you'll find it easy to adapt here. So, seize the opportunity to discover the world of data analysis in Web3!
This post and the codes for this Dune board were written by our intern Aria Suen, and edited by Kristen Peng.