
How to Start Your Data Analysis Journey from Scratch

Our intern Bradley Lin wrote this piece in the first person. We hope that whoever wants to start your data analsis journey can learn from his experience.
Introduction
If you find yourself standing at the threshold of the crypto world, surrounded by terms like DeFi, Web3, and blockchain, do not worry! I've been in your shoes and can attest that it's never too late to begin your data analysis journey. Despite having only a modest background in Python, I have successfully ventured into the realm of collecting and analyzing data from the Web3 Ethereum network. In this blog post, I'll share my experience (specifically on how I did my research on the relationship between gas and transactions on L2) guiding you on how to get started with data analysis in this exciting domain.
Starting from Scratch
Let's lay the groundwork before diving into the analysis. To begin your data analysis journey, you need two essential elements: knowing where to look and having the necessary tools to examine the data. Fortunately, everything on Web3 is fully transparent and public, with all transactions and data stored on decentralized blockchains. In this blog post, we'll focus on Ethereum, a decentralized global software platform powered by blockchain technology, offering a diverse range of cryptocurrencies, digital money payments, and DeFi applications.
Understand gas and Layer 2 (L2)
In Ethereum's network, validators play a crucial role in managing and validating on-chain data. They are rewarded with gas fees, which are transaction fees paid for their services. The amount of gas required for a transaction depends on its complexity, as more intricate transactions demand additional computation resources.
L2 refers to a protocol built on top of the existing blockchain infrastructure, known as Layer 1 (L1). L2 roll-up solutions like Optimism, Arbitrum, Starknet, and ZKsync aim to address scalability challenges by processing more transactions in less time. By reducing transaction sizes and minimizing computational work on the mainnet, L2 solutions enable significantly higher transactions per second and lower gas costs.
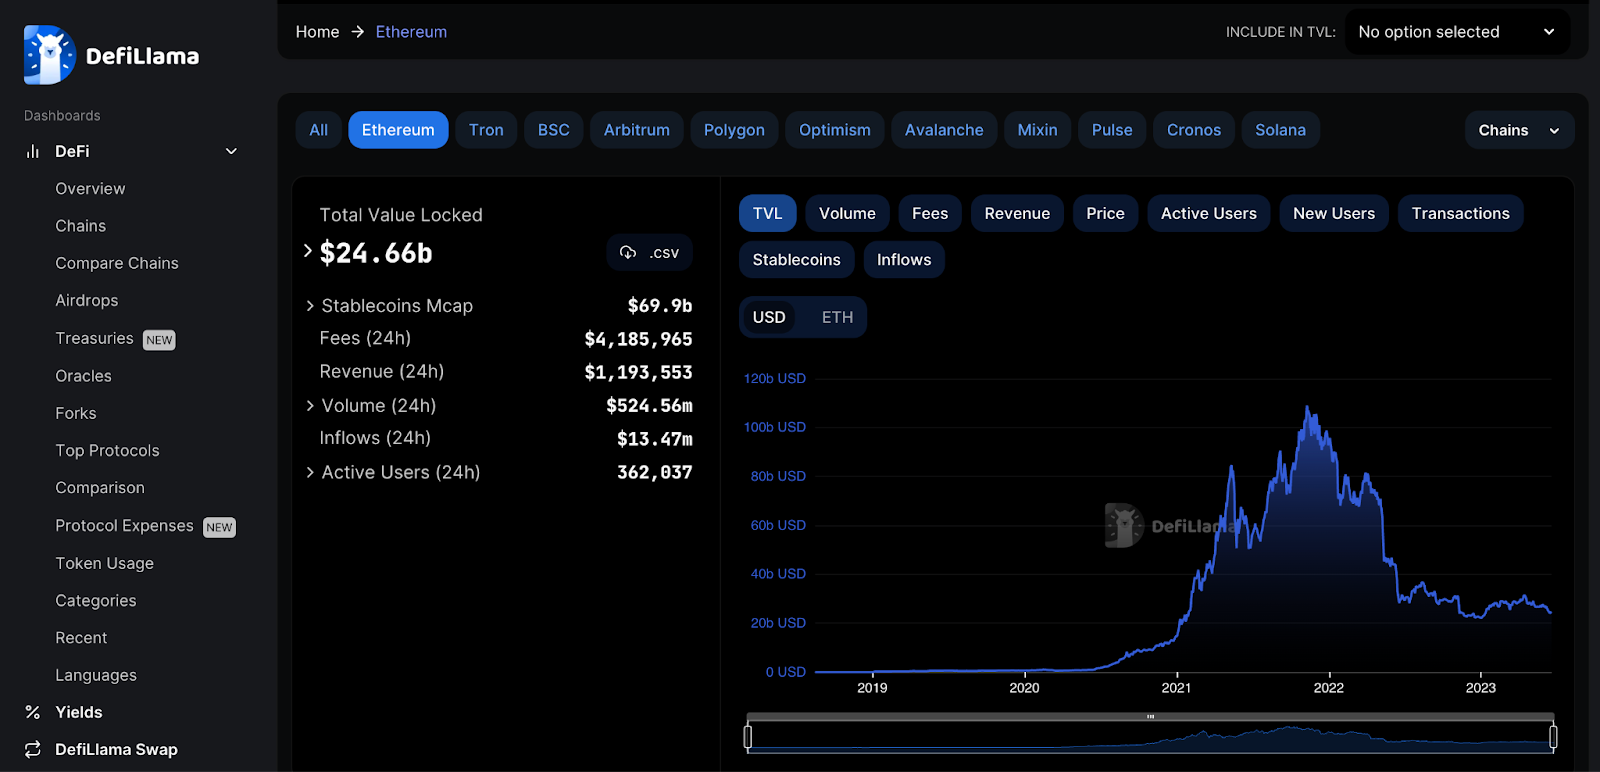
So, what is the connection between gas and L2? Despite being the largest decentralized financial platform with a total value locked (TVL) of 24.66 billion USD (according to DefiLlama as of the time of writing this blog), Ethereum faces notable challenges. It can only process a limited number of transactions at a given time and is costly to use. With a transaction processing capacity of fewer than 20 transactions per second (TPS), Ethereum experiences congestion and high gas fees. The blockchain technology is confronted by a trilemma, where decentralization, security, and scalability pose trade-offs. To address these challenges, L2 solutions have emerged to enhance scalability and reduce costs.
By understanding the high-level relationship between gas and L2, you can gain a clear direction for your data analysis topic moving forward. This understanding will enable you to explore the impact of L2 solutions on gas usage and scalability within the Ethereum ecosystem.
Accessing Ethereum Data
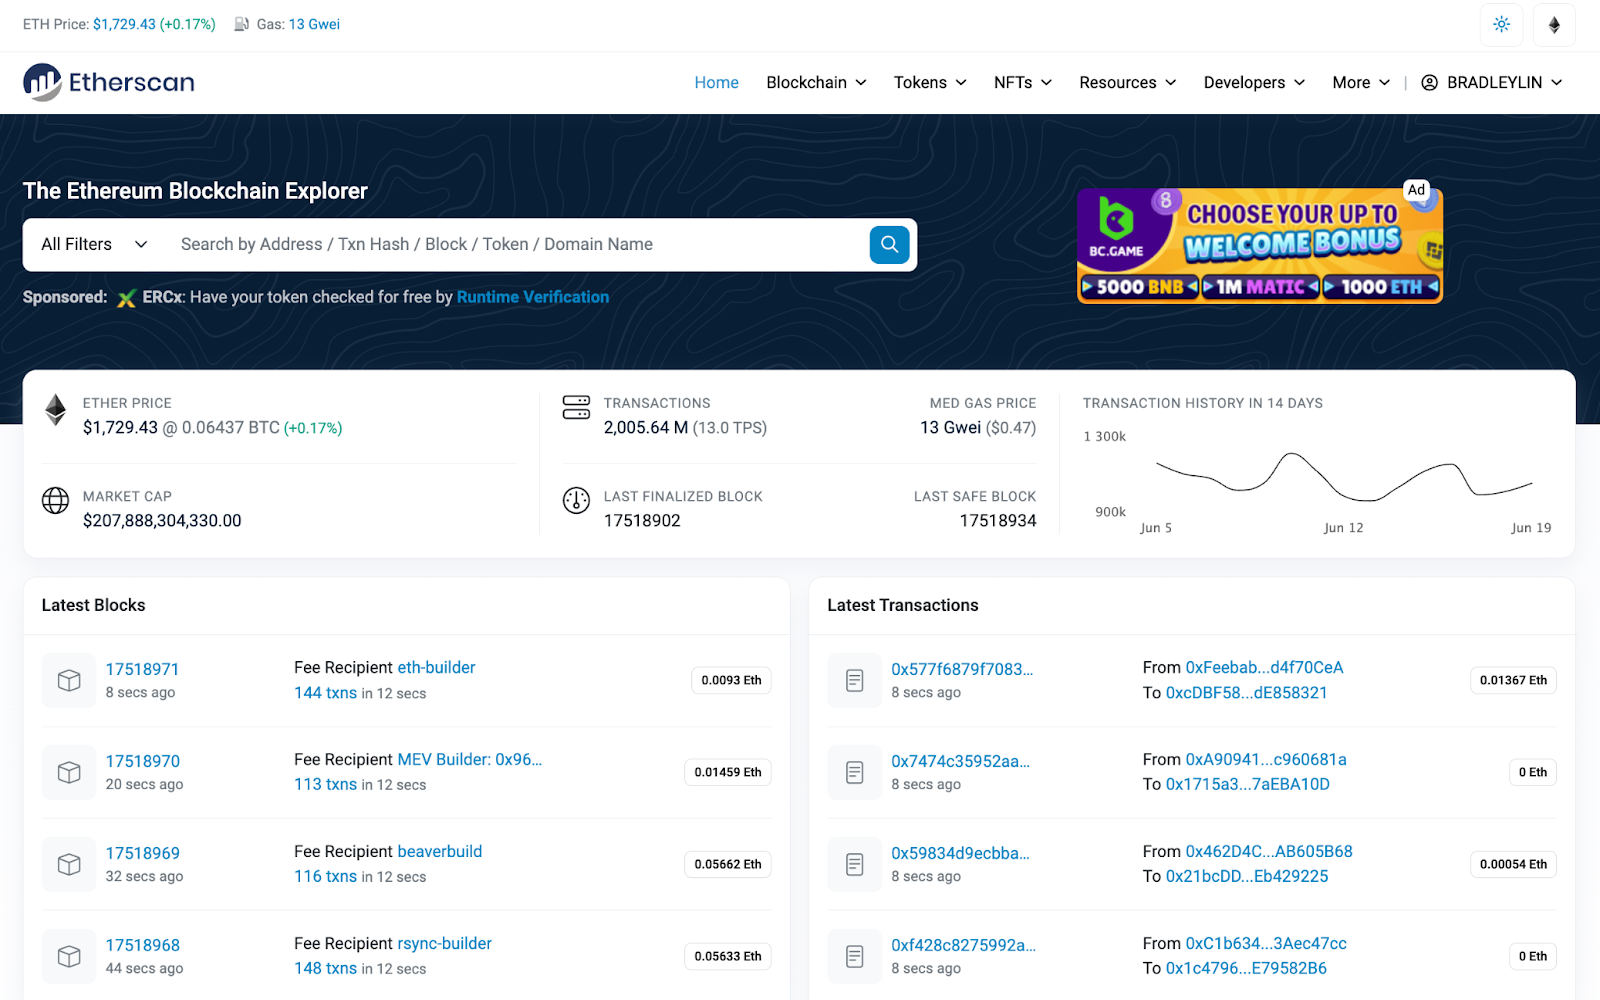
The most convenient way to access data is through a block explorer called Etherscan. Etherscan acts as a window into the Ethereum blockchain, providing information such as wallet balances, transactional details, gas usage, and more. For my research on the relationship between gas usage and L2 solutions, Etherscan served as the primary source of data.
Equipping Yourself with the Right Tools
Now that you know where to find the data, let's discuss the tools you'll need to perform data analysis on Ethereum. I relied on Visual Studio Code and Jupyter Notebook as my Python coding editor software for all my data analysis projects. These tools offer a user-friendly and intuitive interface, especially Jupyter Notebook, which allows you to edit and run individual cells, making it perfect for coding beginners like myself.
Additionally, you'll need to install the "requests" library, which enables sending HTTP requests easily. This library proves invaluable as Etherscan provides free API endpoints that return Ethereum blockchain data. By utilizing the requests library, you can effortlessly call the appropriate Etherscan API endpoint and collect and filter the desired data.
Analyzing the Relationship Between Gas Usage and Transactions on L2
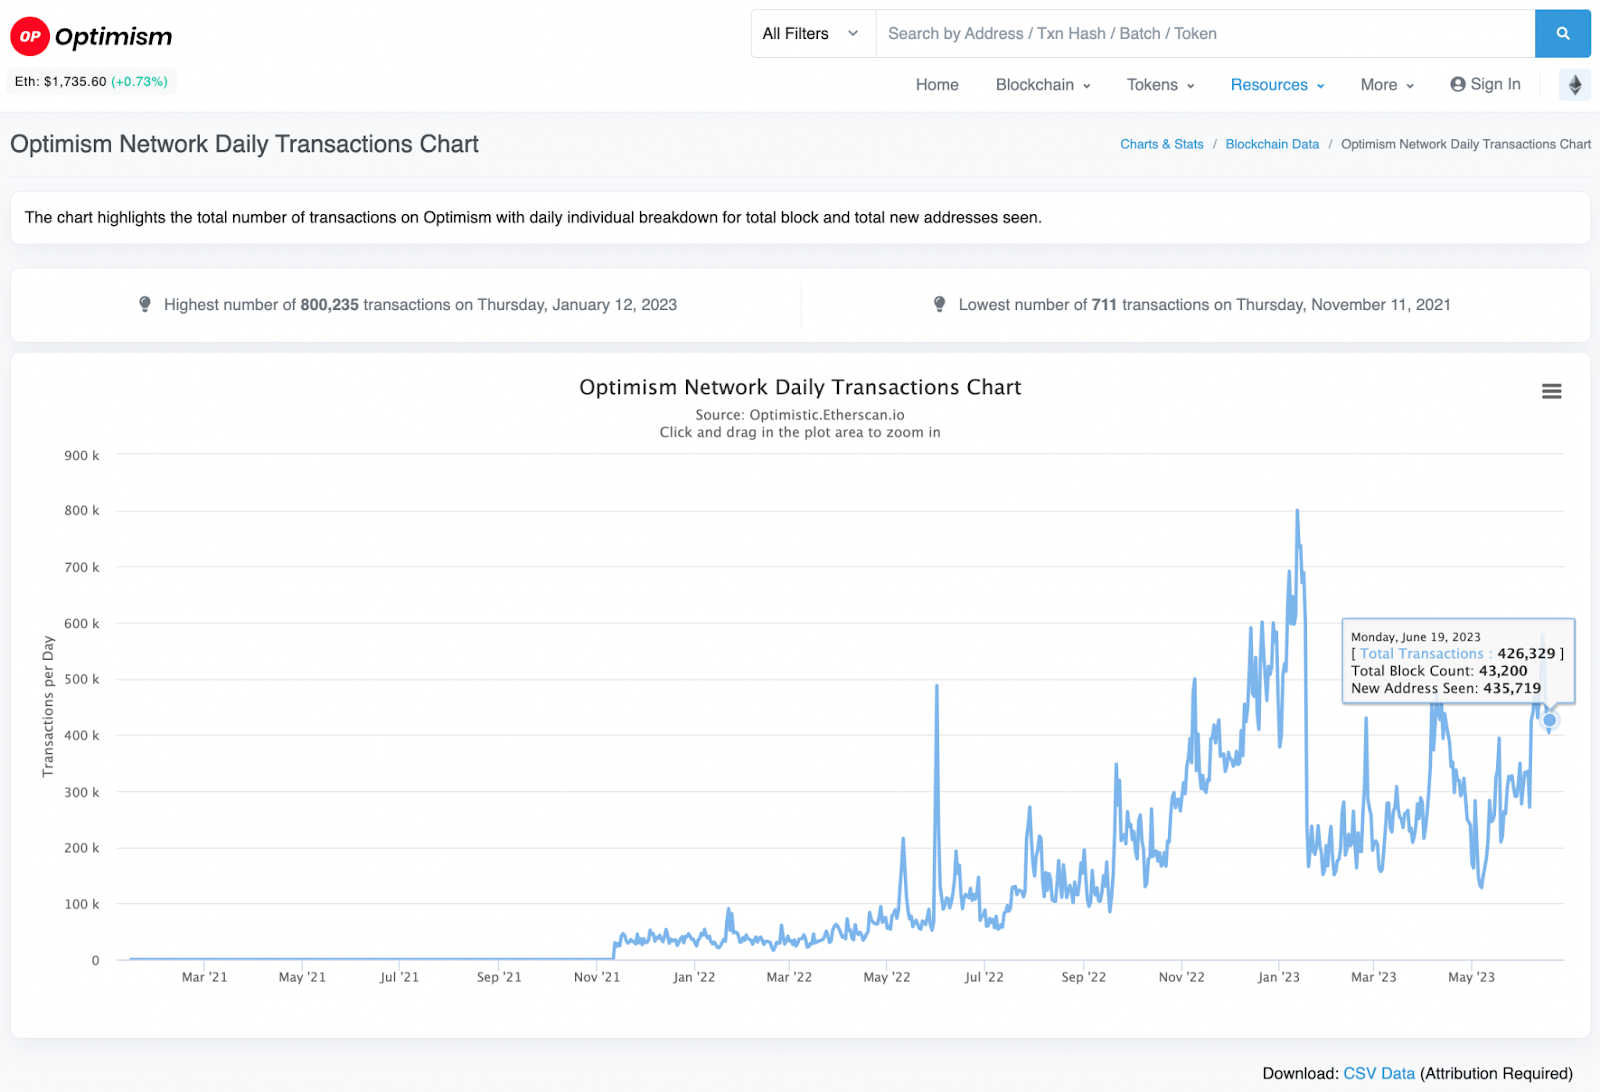
To analyze the relationship between gas usage and transactions (txs) on the Layer 2 (L2) protocol, it is imperative to gather relevant data, such as transaction sizes on L2 and the corresponding gas usage. For the purpose of this discussion, let's focus on Optimism as an example. Optimism's daily transaction data can conveniently be obtained from optimism.etherscan.io in the form of a CSV file.
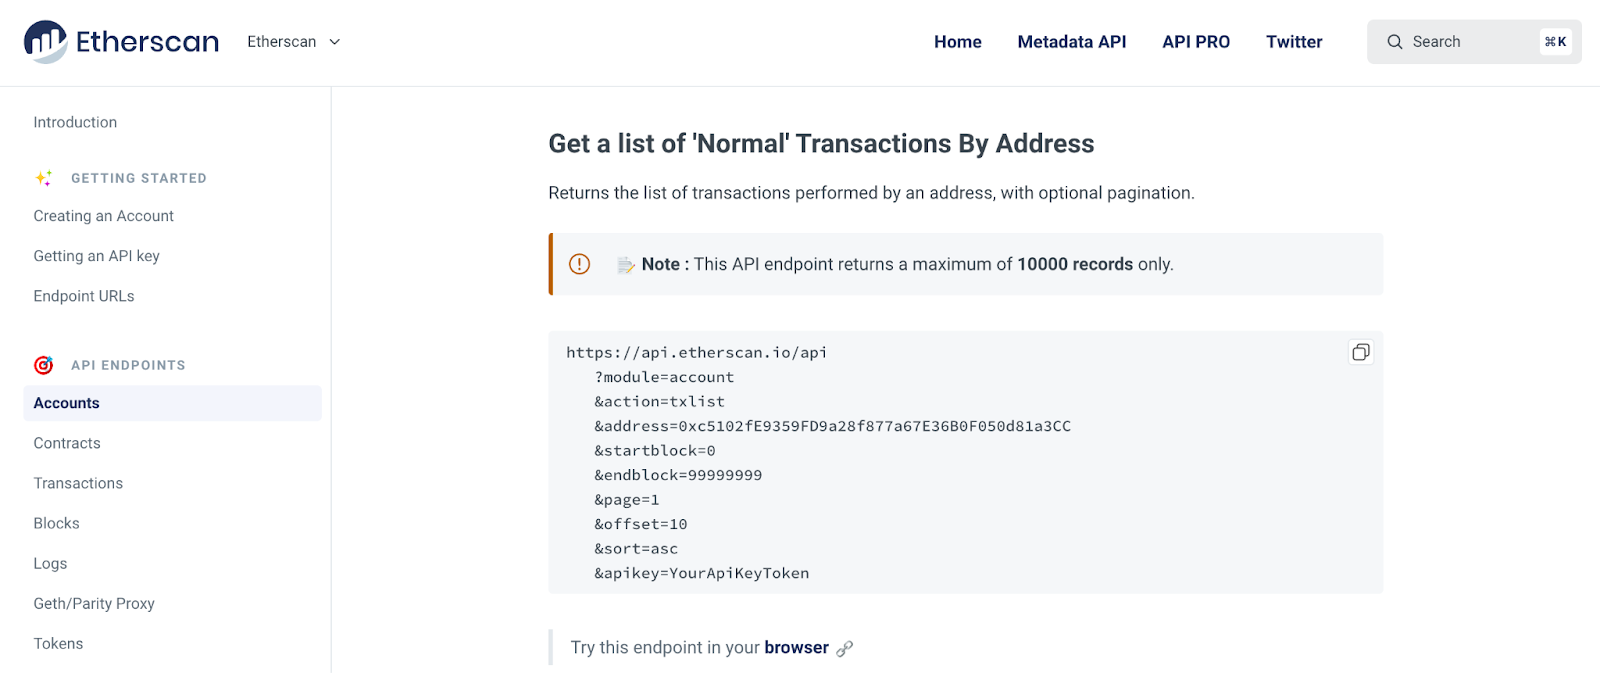
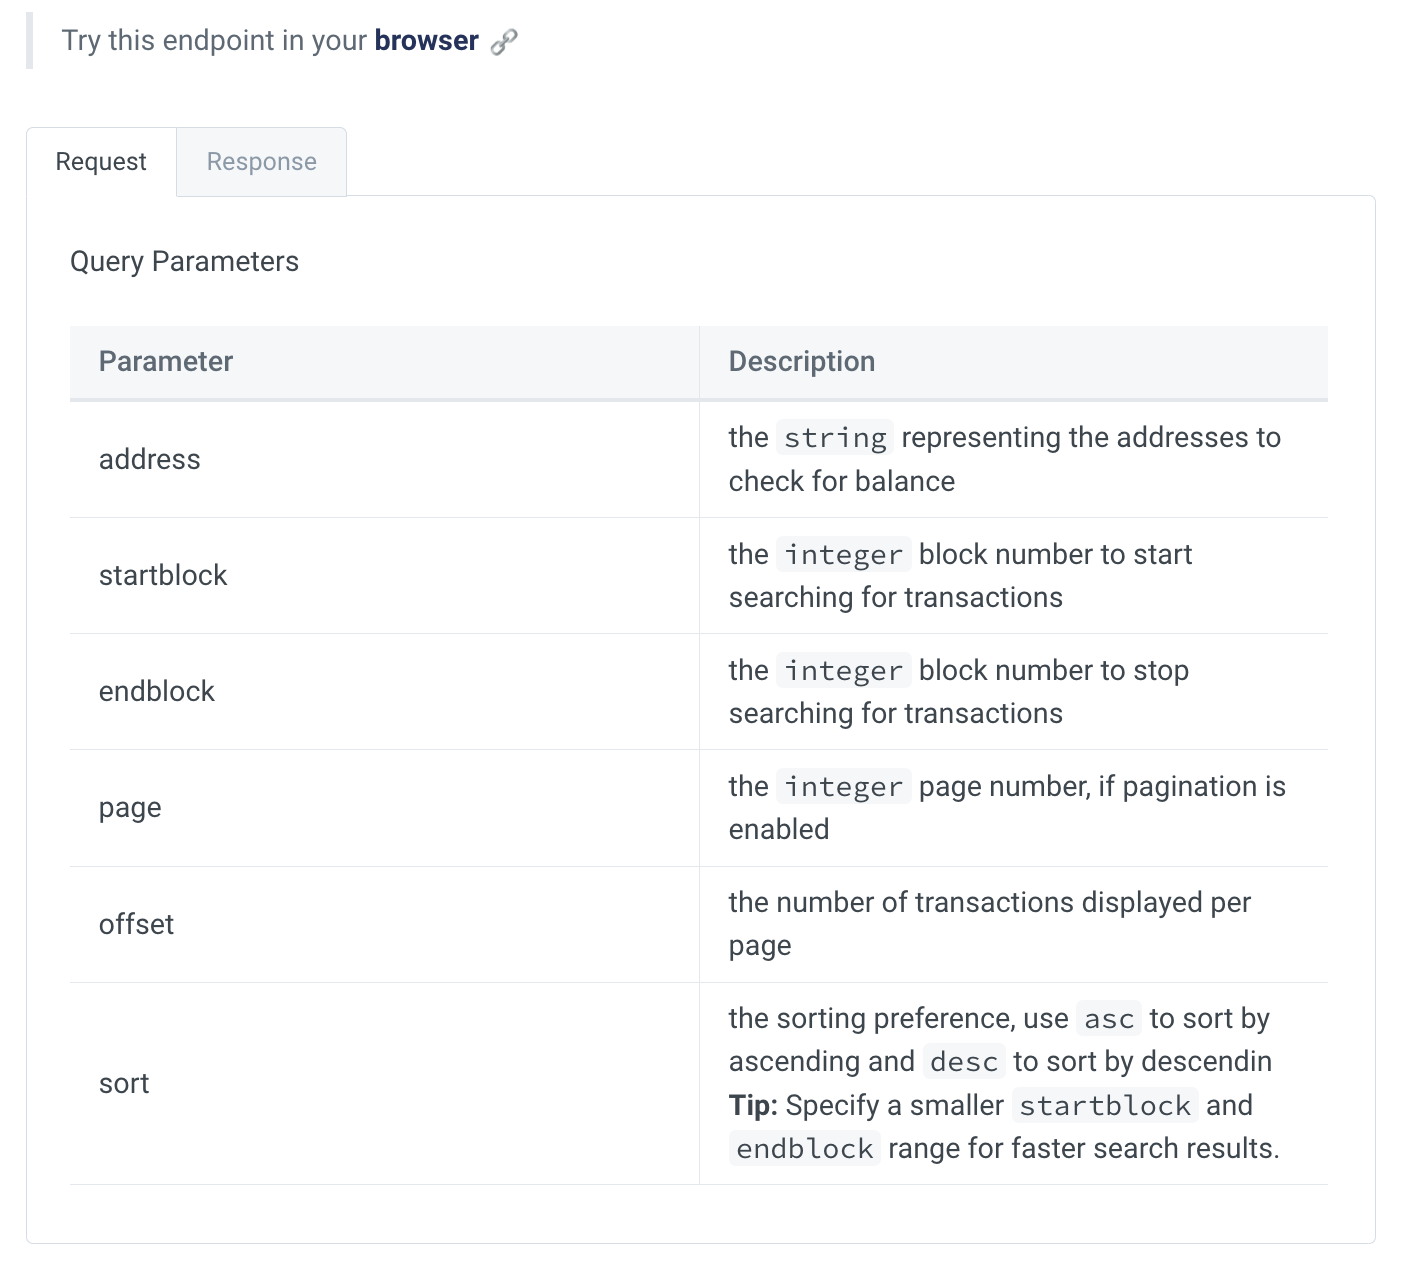
However, retrieving the gas usage data for Optimism presents a slightly more intricate process. This transactional information is stored on the Ethereum blockchain, and access to it can be obtained through the Etherscan API by specifying the Optimism wallet address and other relevant parameters.
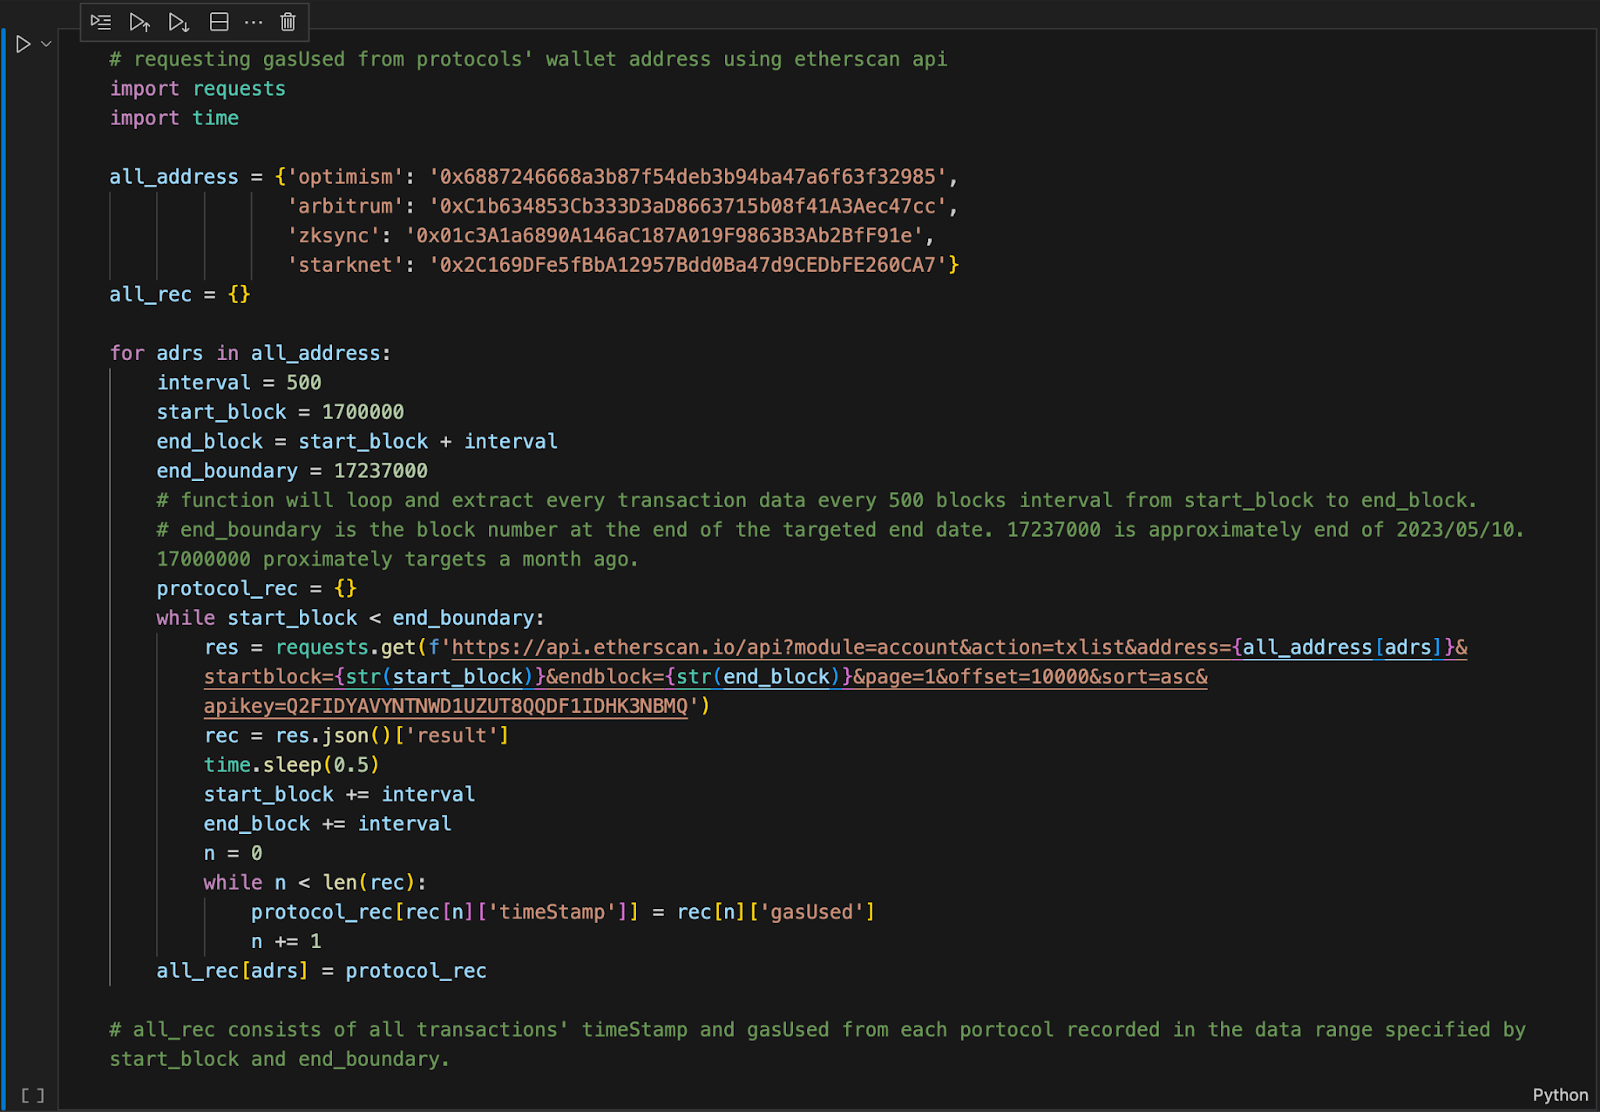
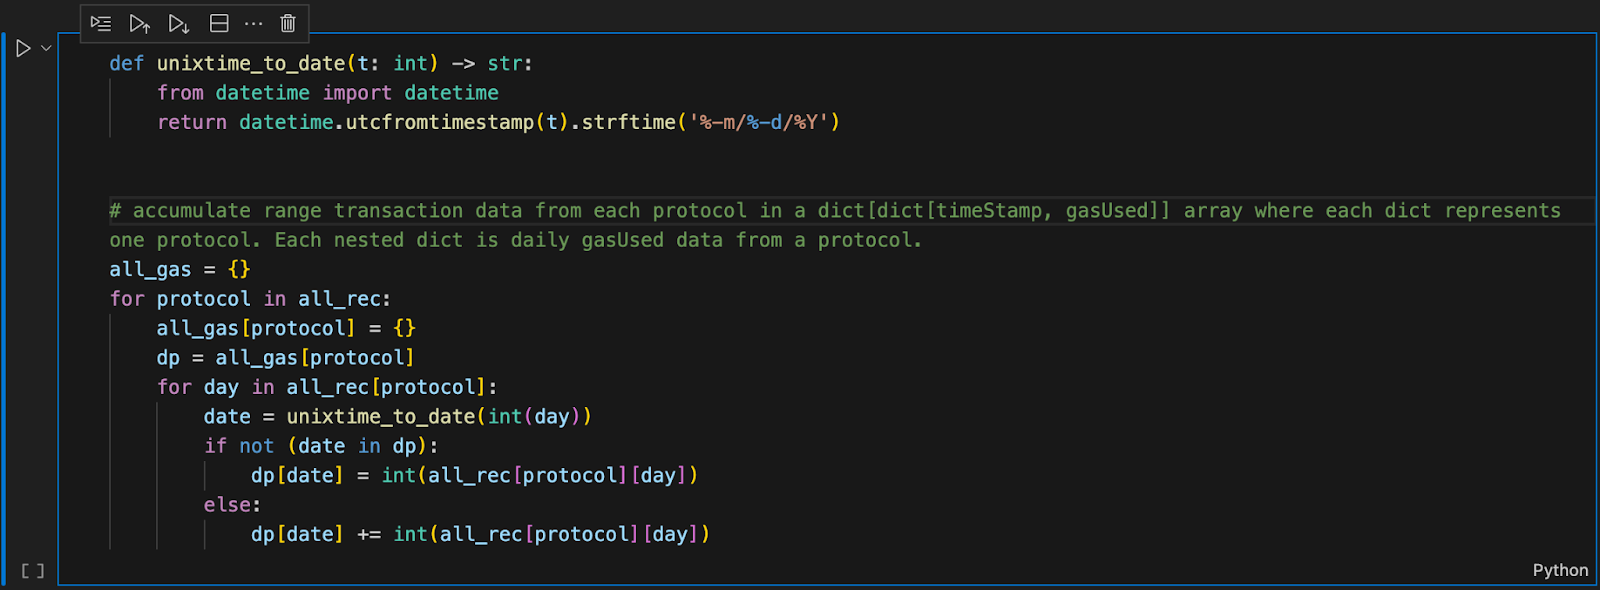
Next, we will construct a simple for loop and utilize the "get" method from the requests library to retrieve the gas used from each transaction (as json) associated with the protocol’s wallet address. Considering that our transaction sizes are recorded on a daily frequency, it is crucial to aggregate the gas used data into the same frequency for better comparison. There is a reason for choosing daily frequency. The amount of gas used heavily depends on the computational complexity of each transaction, resulting in significant variations between different transaction types, such as transfers and mints. By aggregating data on a daily basis, we assume that each day occurs a similar fraction of transactions across various levels of computation resources required. Additionally, the accumulation of a large number of transactions helps mitigate the impact of differences in computation complexity.
Below is my for loop to extract gas used data from 4 different L2 protocols (i.e. Optimism, Arbitrum, ZKSync, Starknet):
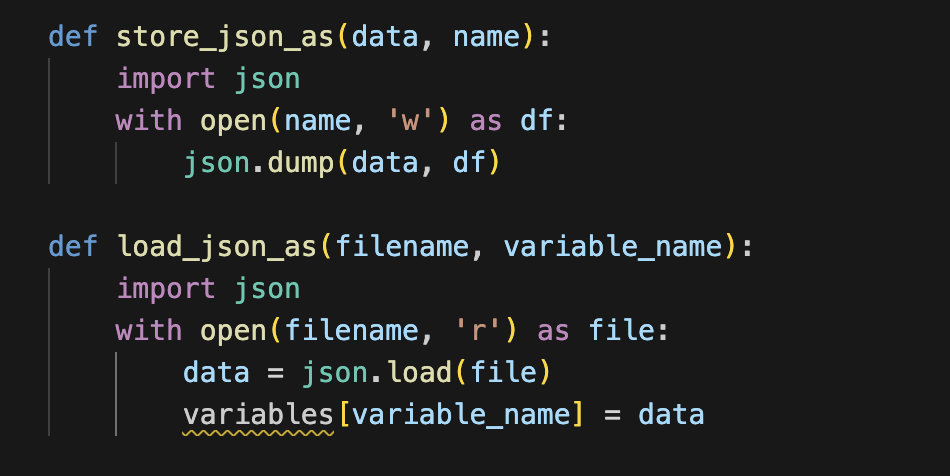
Here's a helpful tip for managing the collected data from the API: consider storing it in a JSON file. This approach allows for easy access to the locally stored data, eliminating the need for repetitive API requests whenever you wish to utilize the collected information. I used this tip to organize the necessary data for my analysis. This minimizes the reliance on frequent API requests. (these were the functions I used. You can write your own version):
Once you have gathered all the relevant protocol data, you can proceed to calculate the average gas used per transaction (tx) on Optimism. To do this, divide the daily gas used by the daily number of transactions. At this stage, you should have three sets of data arrays in daily frequencies that are crucial for conducting the main analysis: daily transactions, daily gas used, and daily average gas used per transaction.
To visually analyze the data and identify any trends or relationships, let us install Matplotlib in your terminal.
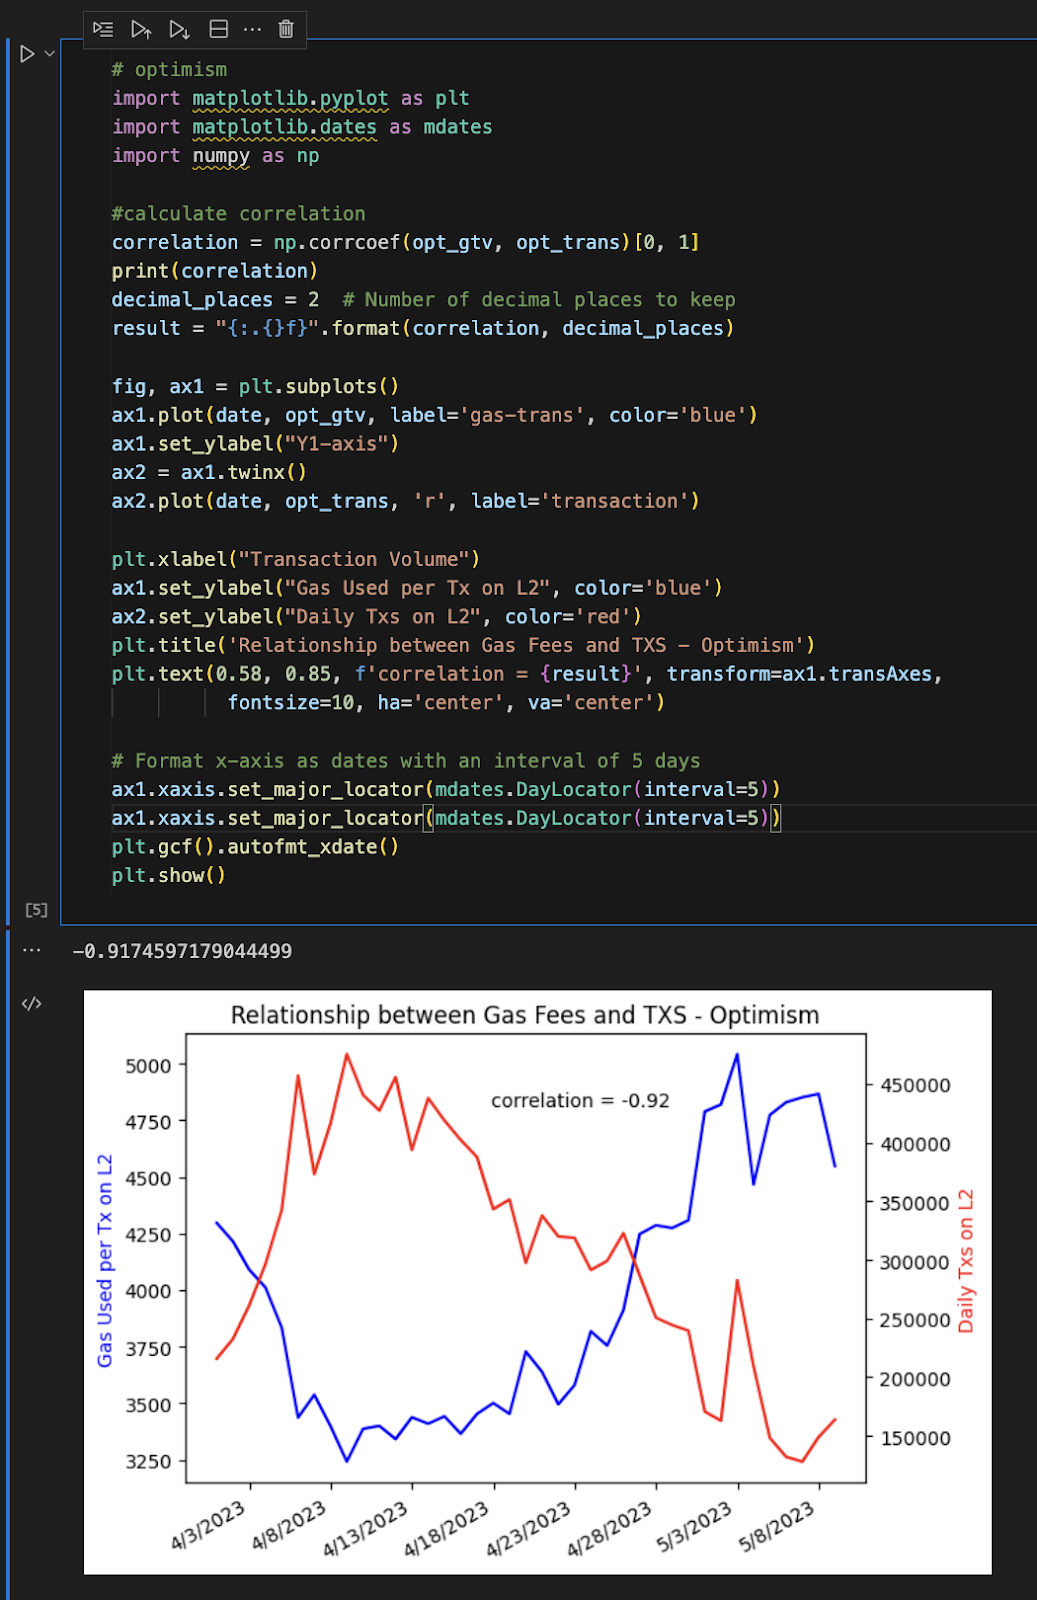
Matplotlib is a Python library that empowers you to create statistical visualizations. Use your daily transaction array and daily gas used per tx array to generate a simple line chart. This visual representation will provide insights into the potential relationship between tx sizes on L2 and the corresponding gas usage.
And there you have it! You have successfully conducted a simple yet robust data analysis on L2s and their gas usage. As mentioned earlier, all data is publicly stored on the blockchain, offering various possibilities for further data analytics topics. The blockchain provides abundant opportunities for exploring and extracting insights from various data types.
Conclusion
Embarking on a data analysis journey in the Web3 Ethereum network may seem daunting at first, but with the right mindset, tools, and resources, you can overcome any initial challenges. Remember, I started with only a basic understanding of Python, and now I'm publishing my research on Term Structure's Twitter. It's never too late to begin your own journey and explore the vast possibilities of data analysis within the exciting realm of Web3 and Ethereum. So go ahead, dive in, and discover the fascinating insights waiting to be unlocked through data analysis in the world of decentralized finance and blockchain technology.
Keep learning, experimenting, and pushing the boundaries of what you can achieve as a data analyst in the Web3 Ethereum network. If you want to do more analytical research on blockchain, I suggest you look into the Python library - web3.py. This is a higher-level library that enables you to interact directly with Ethereum through Python which would help with your data collection moving forward. And a way to share your analytic work with the web3 community is to submit your work on Dune Analytics. You can use an SQL language to write a query, show it as a dashboard, and then display it as a page. And that will come in handy if you want to demonstrate your skills to your future employers. Good luck with your data analysis endeavors, and may you uncover remarkable discoveries along the way!